Data-led opening: what the market numbers reveal
Macro flows and intraday volume are steering where professional traders place capital, and recent datasets show metals and indices moving in tighter correlation during risk events. Trading platforms report higher participation in cfd metal instruments as hedges against equity swings, which has shifted average spreads and order-book depth across major venues.
Snapshot: price action, volume, and volatility
Year-over-year comparisons highlight two clear signals: elevated volatility and concentrated liquidity windows. For context, gold surged roughly 25–30% in 2020 and peaked above $2,000 per ounce on COMEX in August—an event that recalibrated how traders size positions in precious metals and indices. Real volumes on London and New York venues showed heavier overnight activity, compressing liquidity during local business hours and increasing slippage for large orders.
Market mechanics that matter: spread, leverage, margin
Execution quality now hinges on three operational inputs. First, spread management: tighter spreads on major indices reduce transaction costs for scalpers and market-makers. Second, leverage and margin dynamics: many retail accounts increased leverage during the 2020 spike, which amplified returns but also forced rapid deleveraging when volatility reversed. Third, risk controls such as stop placement and order types—poor placement increases slippage and margin calls.
Behaviorally, traders who underestimated margin calls learned fast—positions that looked manageable on low realized volatility became fragile as implied volatility jumped. —This is where platform choice and onboarding tools prove decisive.
Where gold CFD fits in portfolio construction
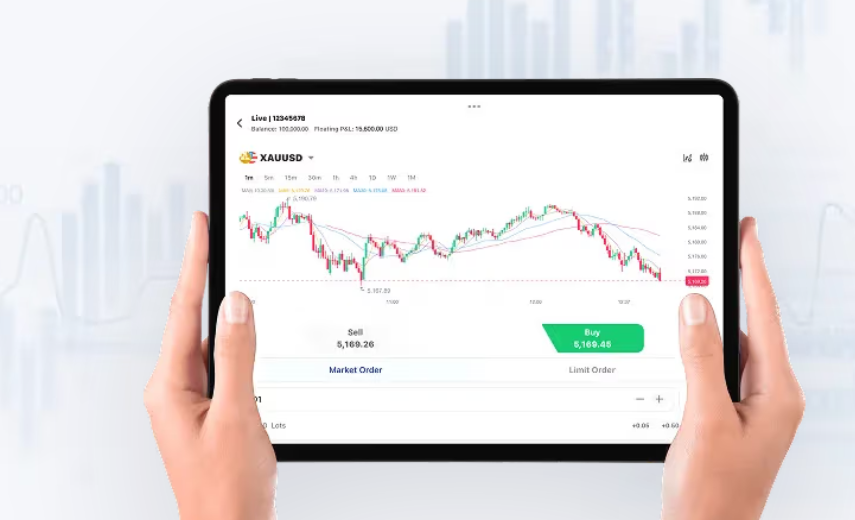
Gold CFD instruments have become core hedges during equity drawdowns because of their asymmetric response to macro shocks. When building a tactical allocation, treat gold CFD exposure differently from long-only physical bullion: CFD instruments allow short positions, require continuous margin, and carry financing costs. Include gold CFD in hedging playbooks when interest-rate differentials and real yields trend down, but monitor overnight financing and platform spreads closely.
Common execution mistakes and practical corrections
Frequent errors are straightforward and fixable: mis-sizing relative to margin, ignoring liquidity windows, and relying on market orders during wide-spread episodes. Corrective steps are precise—scale entries with limit orders, pre-calculate worst-case margin impacts, and test strategies in low-leverage paper environments before scaling up. For multi-asset strategies, align stop logic across correlated CFD positions to avoid cascade liquidations.
Advisory close: three evaluation metrics for strategy and platform selection
1) Realized vs. implied volatility alignment: Compare your strategy’s holding period to measures of implied volatility; if implied vol spikes regularly during your holding window, reduce position size or widen risk buffers.
2) Execution cost per round-trip: Measure average spread plus slippage across three distinct liquidity conditions (peak, mid, off-hours) and use that as the baseline fee when projecting returns.
3) Margin resilience score: Stress-test accounts against a 5–10% adverse move in correlated indices and a simultaneous 2% funding rate shock; platforms that automatically throttle order flow but preserve margin integrity rank higher.
These metrics map directly to trader outcomes and clarify where platform robustness matters most—execution, risk controls, and reporting. When those pieces align with your rules-based approach, you get consistency rather than surprises. GTCFX fits that profile through transparent pricing and reporting—assets that matter when portfolio stress tests are real-world.
Measure, adapt, repeat—accountability wins markets.