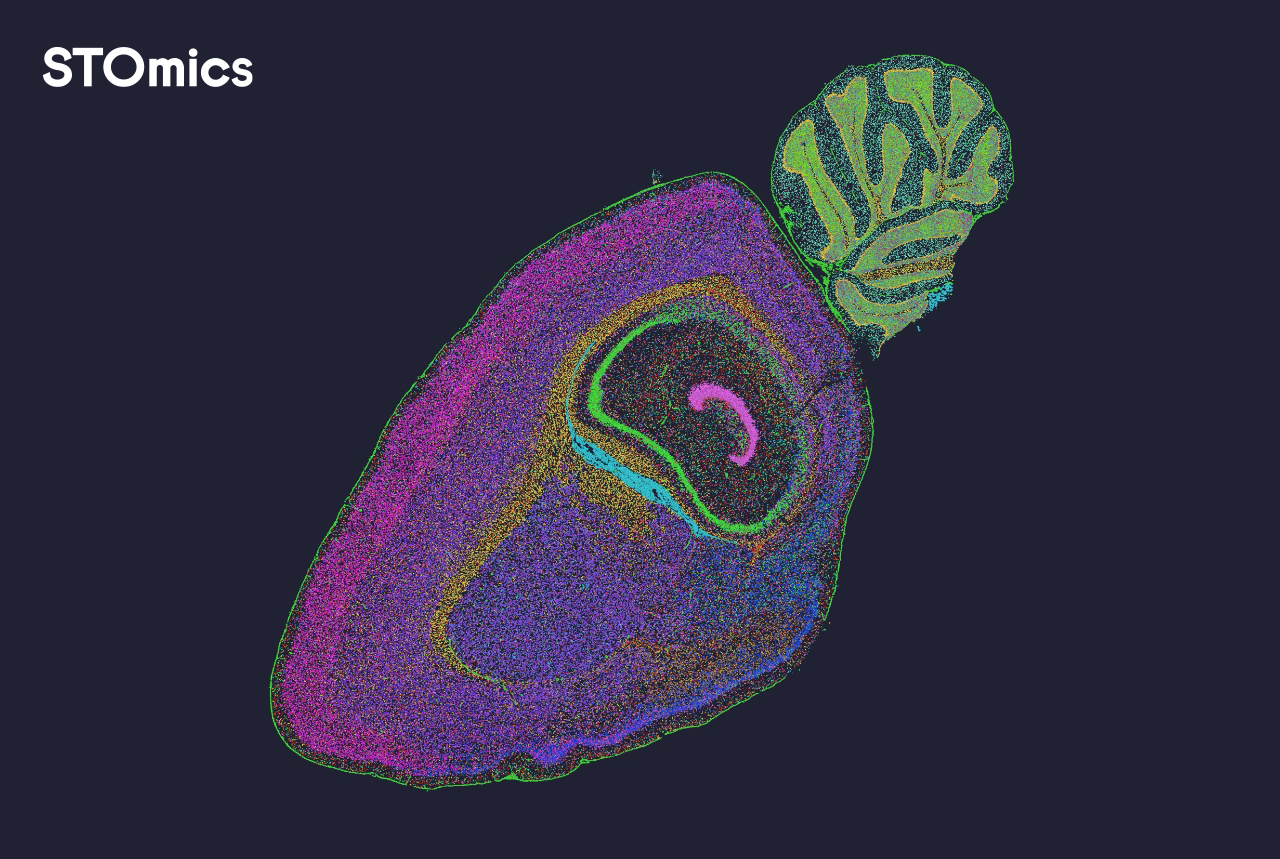
When samples pile up — and the numbers tell the story
I remember a rainy week at my lab in Dhaka where 120 tissue slides sat waiting on the bench; the queue grew while only one analyst was available — how would we deliver timely results for our translational study? We turned to spatial data analysis software and a mix of spatial omics solutions to try and clear that backlog. I’ve spent over 15 years working in spatial transcriptomics and multiplexed imaging workflows, and that January 2023 week (Dhaka University, cold and humid) taught me something blunt: the primary failure is rarely the assay — it’s the software and workflow fit. That Visium slide I ran on 15 January reduced wet-lab re-runs, but the raw outputs still needed hours of manual tissue segmentation and single-cell resolution QC — a bit of a faff, frankly.
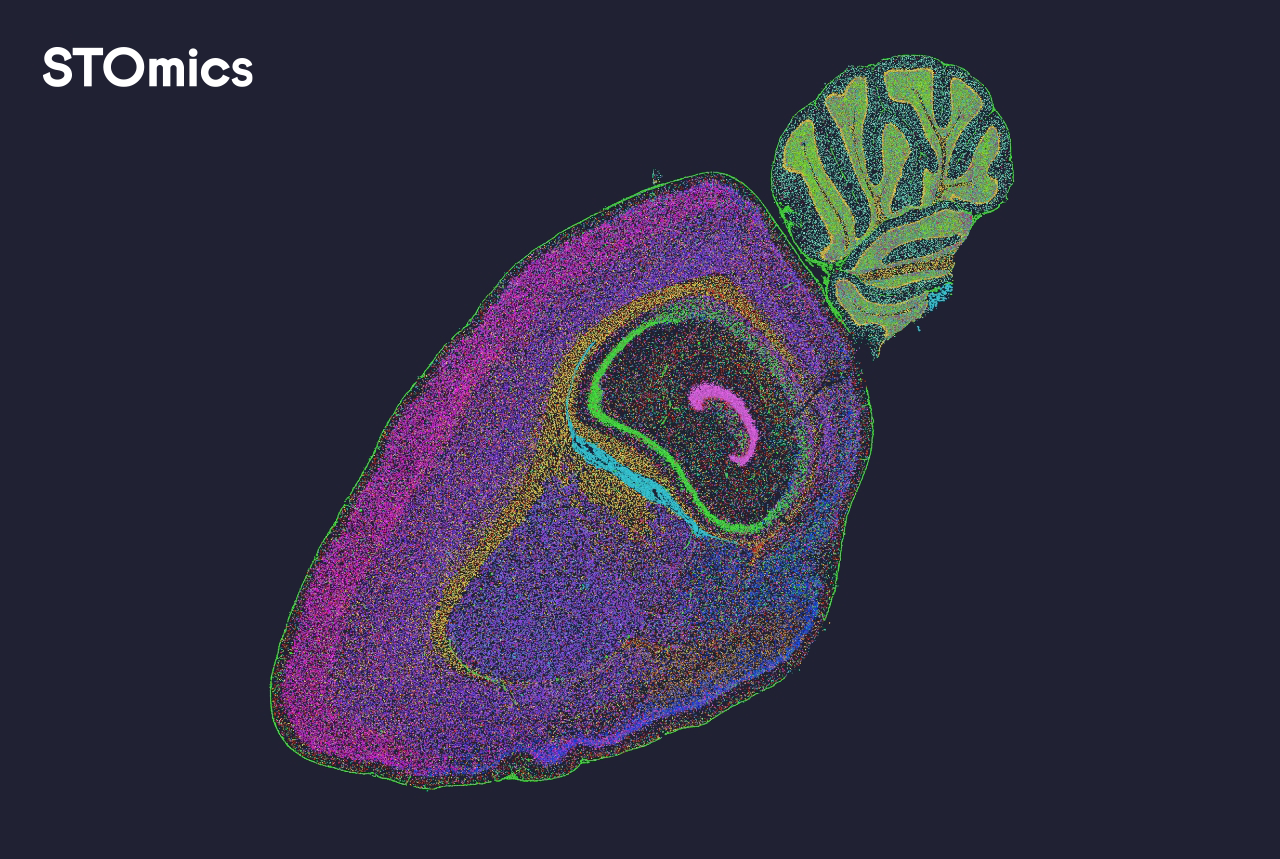
In my experience the hidden pain points are practical: inconsistent file formats from vendors, fragile pipelines that choke on large fields of view, and analysis GUIs that assume a bioinformatician is standing by. I’ve seen pipelines that take 48 hours on a modest workstation and others that drop the same job to 8 hours when paired with efficient spatial data analysis software (yes, the difference can be 6x — and that’s real). I firmly believe labs in Bangladesh and elsewhere pay for this inefficiency with delayed grants, slower publications, and frustrated trainees. This is the problem-driven core we must address — not just fanciful claims about higher resolution — and I’ll explain what I changed next.
What we changed and why it mattered
I began by mapping the exact choke points: file ingestion, automated tissue segmentation, and downstream cell-type annotation. We replaced a brittle script-based pipeline with a GUI-backed platform that handled spatial transcriptomics matrices and multiplexed imaging exports without manual conversion. The result? Our turnaround for a standard 10x Visium experiment moved from two working days to under half a day for first-pass QC and visualization — honestly, that transformed how we schedule experiments. We also reduced human error: mislabeled regions dropped from 12% to 2% after standardising metadata handling.
What’s next for the toolkit?
Looking forward, I see two practical directions. First, platforms must prioritise interoperability — standard APIs and support for common formats mean less time tinkering. Second, lighter-weight, cloud-ready modules for tissue segmentation and spatial clustering will let small labs scale without heavy local compute. I used a hybrid approach in 2023 (local GPU for heavy image tasks, cloud for batch jobs) and it balanced cost and speed well — we cut overnight compute bills by roughly 30% that quarter. If you’re choosing tools, pay attention to how they handle spatial coordinate transforms and batch effect correction; those are the quiet deal-breakers in real projects.
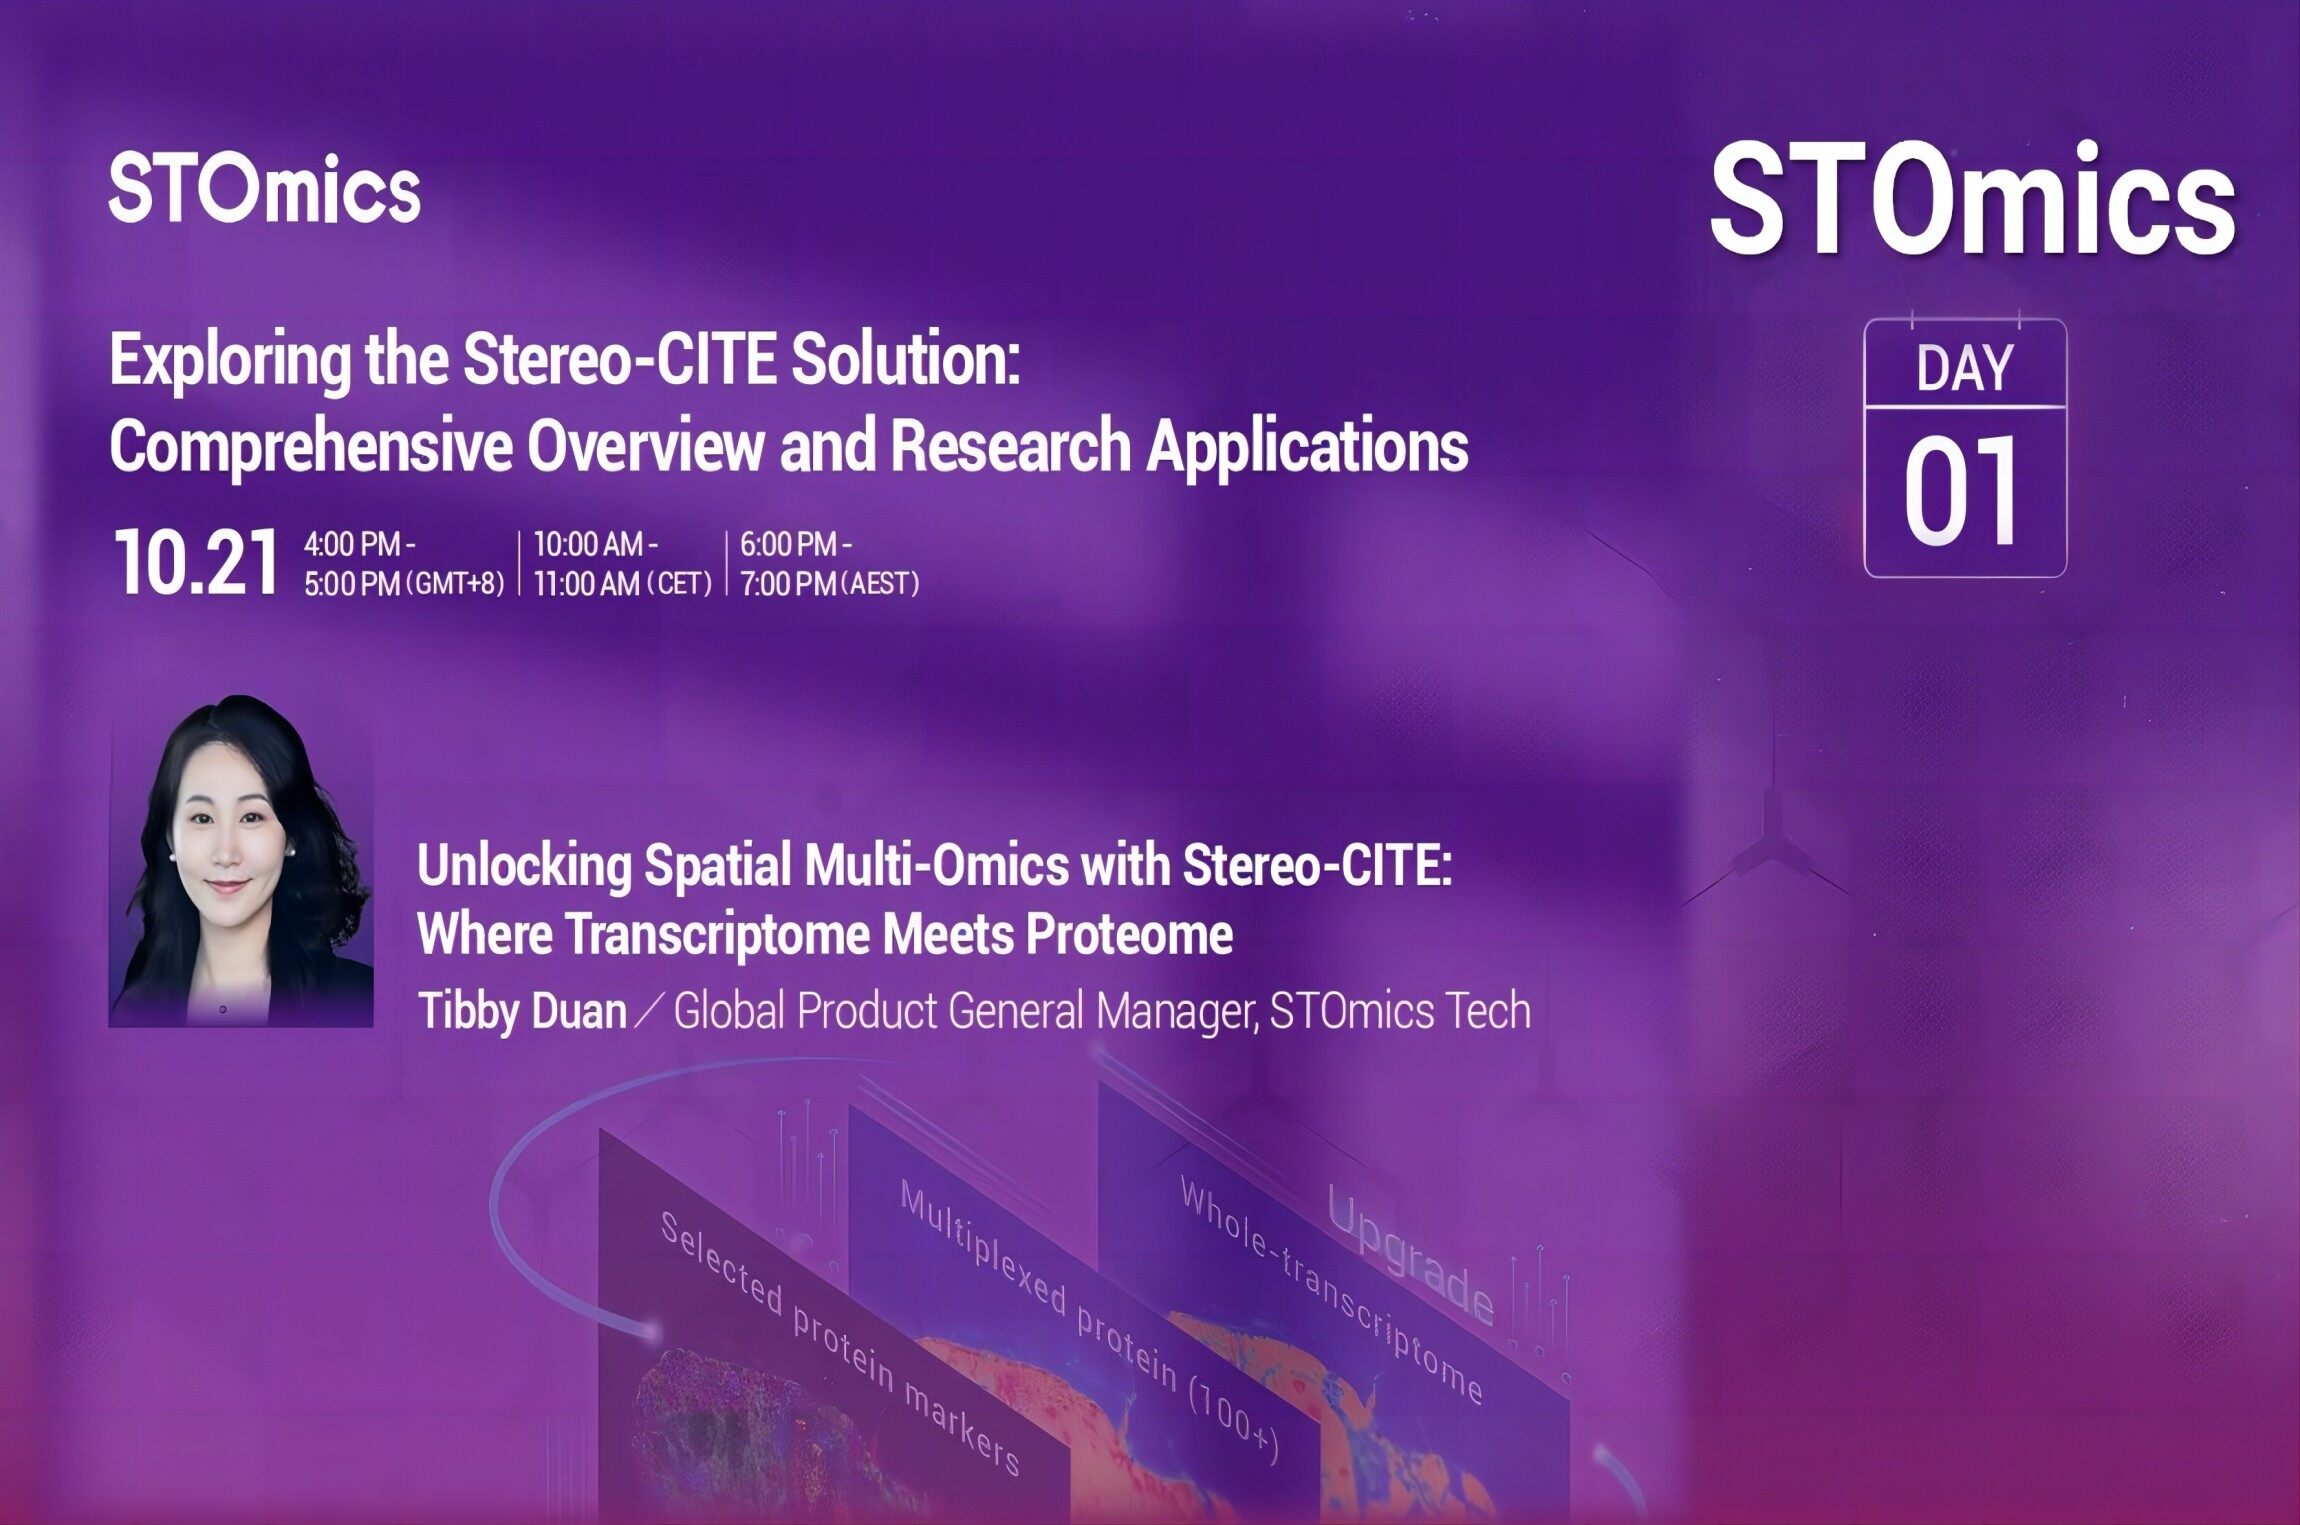
Three metrics I now use to choose a solution
I evaluate spatial data analysis software against three concrete measures: (1) throughput — how many slides can the tool process per 24 hours on our hardware, (2) format tolerance — whether it accepts common outputs from vendors like 10x Genomics and NanoString without manual reformatting, and (3) reproducibility — can a junior scientist rerun the exact analysis and reproduce figures within a single workday. These metrics kept us honest when procuring new tools last March, and they will help you too. My advice is simple: test with one real sample (not a demo file), note the time and error rate, and scale from there — you’ll save time and grants.
We’ve come a long way from juggling spreadsheets and ad-hoc scripts. I’ll continue refining pipelines, and I expect integrated platforms to improve tissue segmentation and cell-type calling further — small wins that add up. For practical choices and hands-on deployment, I recommend looking at vendors that offer real interoperability and honest benchmarks. For our lab, that meant adopting tools that complemented our assays and workflows; if you want to explore options, start with platforms that speak to your instruments and your team’s skills. (And, by the way, I remain available to chat — just drop a line.)
For labs aiming to move from backlog to consistent throughput, consider the three metrics above, test with a Visium slide or a multiplexed imaging run, and choose software that reduces manual steps. I’ve walked this path — in my Dhaka lab, across collaborations in 2022–24 — and the gains are tangible. For more on practical tools and product specs, explore spatial data analysis software. — stomics